SECCION Crisis monetaria: US/EURO, dolar vs otras monedas

Gráfico del tipo de cambio del Dólar Americano al Euro - Desde dic 1, 2008 a dic 31, 2008

Evolucion del dolar contra el euro

US Dollar to Euro Exchange Rate Graph - Jan 7, 2004 to Jan 5, 2009

V. SECCION: M. PRIMAS

1. SECCION:materias primas en linea:precios


[Most Recent Quotes from www.kitco.com]


METALES A 30 DIAS click sobre la imagen
(click sur l´image)

3. PRIX DU CUIVRE

  Cobre a 30 d [Most Recent Quotes from www.kitco.com]

4. ARGENT/SILVER/PLATA

5. GOLD/OR/ORO

6. precio zinc

7. prix du plomb

8. nickel price

10. PRIX essence


petrole on line

Find out how to invest in energy stocks at EnergyAndCapital.com.

azucar

azucar
mercados,materias primas,azucar,precios y graficos azucar i otros

24 feb 2011

Macroperu Bolivia: gobernar obedeciendo a la gente


Bolivia: gobernar obedeciendo a la gente
Política en las calles en Bolivia

Por BENJAMIN DANGL

Desde el norte de África a Wisconsin, los activistas se desplaza por un nuevo terreno de la protesta mundial y las relaciones con sus gobiernos. Ya sea en derrocar a los tiranos de edad o hacer frente a nuevos aliados en el poder, el ejemplo de Bolivia tiene muchas lecciones para los movimientos sociales. Una dinámica ilustrativo es que ahora se despliega en este país andino, donde los movimientos tienen gran influencia sobre el palacio de gobierno, y el presidente izquierdista Evo Morales dice que "gobierna obedeciendo al pueblo". Pero a veces la gente no le da ninguna otra opción.

El día de Navidad tras año pasado, mientras que Morales se encontraba en Venezuela, el vicepresidente Álvaro García Linera anunció que, como una forma de reducir el gasto público, las subvenciones a gas se redujo, resultando en un aumento de precios más o menos 73% para los bolivianos. En problemas de liquidez Bolivia, donde gran parte de la población vive por debajo del umbral de pobreza, esta medida de austeridad iba a nacer en gran medida de las espaldas de los pobres.

Los aspectos de la política neoliberal conmocionado e indignado gran parte del país. Bolivia comentarista político Rafael Bautista escribió que la subida de los precios del gas seguido la misma lógica neoliberal como predecesores de derecha de Morales, que abarca el concepto de que "tener más dinero que debe sacrificar a los que no tienen nada ..." Bautista continuó, "pero que establece estos precios? No son los pobres, es el mercado". En este caso el gobierno estaba escuchando al mercado sobre el pueblo, y el precio debía pagarse con el "hambre de los pobres".

La medida también traicionó la lucha social de décadas de antigüedad para el uso de los recursos naturales en beneficio del país. Bolivia tiene las mayores reservas de gas natural en América del Sur, y el propio Morales entro al gobierno en una ola de protestas exigiendo la nacionalización del gas y el acceso popular a los recursos naturales. Siguió adelante con la nacionalización parcial en 2006, y ha cumplido otras promesas de campaña, como la reescritura de la constitución, ampliación de la reforma agraria y los servicios sociales, y potenciar a las comunidades indígenas.

Los movimientos sociales de Bolivia respondieron a la convocatoria de la subida de los precios de inmediato, la organización de protestas, huelgas y bloqueos de carreteras en todo el país para exigir que el gobierno hacia abajo. Incluso los productores de coca, firmes aliados de Morales, creado bloqueos de carreteras en una carretera importante. Los conductores de autobuses se declararon en huelga, y las organizaciones de la comunidad en El Alto marcharon, atacando los edificios gubernamentales. Fue un rechazo histórico-generales de la política, con algo más que las organizaciones y sectores de partida habitual en las calles.

En un esfuerzo para compensar el aumento de los precios de la gasolina y los alimentos, el gobierno de Morales planteó los salarios de los empleados públicos en un 20%. Sin embargo, el incremento salarial no ayudar a los trabajadores en el sector privado informal y masiva. El gobierno también ofreció ayuda a los agricultores de arroz, el trigo y el maíz. Sin embargo, los precios de la gasolina y el costo posterior de alimentos, bienes básicos y el transporte sigue aumentando.

Por último, el 31 de diciembre, ya que las protestas no daba señales de parar, Morales cedió, diciendo que podría revertir el aumento de precios. En un discurso televisado, dijo que "seguiría gobernando obedeciendo al pueblo". (similar a la frase "Mandar obedeciendo", una consigna utilizada por los zapatistas.)

¿Estaba obedeciendo al pueblo, o estaba simplemente obligados a responder a la presión? En cualquier caso, su cambio fue significativo, mientras que políticos de todo el mundo han respondido recientemente a las protestas contra las medidas de austeridad con los tanques y las balas, Morales respondió (finalmente) de acuerdo con los manifestantes y dio atrás. Esto pone de manifiesto la autonomía de los movimientos sociales de Bolivia y el poder que tienen sobre el gobierno.

Durante la última década, los movimientos sociales en Bolivia han sido los protagonistas de la historia del país. Esto se debe a que muchos de ellos entiende que la lucha por un mundo mejor no terminó con el derrocamiento del ex presidente derechista Gonzalo Sánchez de Lozada en 2003, o incluso con la elección de Evo Morales en 2006. Su lucha requiere la movilización constante y la transformación social que no encajaba en un decreto del gobierno o de una urna.

"Creo que no estamos reconsiderando sólo una nueva forma de hacer política, pero sobre todo una nueva forma de gestionar nuestra economía", dijo el líder activista boliviano Oscar Olivera en una entrevista de América Latina Centro de Solidaridad en el reciente conflicto del gas. "En esto, es la gente que están haciendo posible."

Benjamin Dangl se basa actualmente en el Paraguay y es el autor de "El precio del fuego: guerras de recursos y movimientos sociales en Bolivia" (AK Press) y Bailando con dinamita: los movimientos sociales y los Estados de América Latina (AK Press). Correo electrónico: Bendangl (arroba) gmail (punto) com.

__._,_.___
__,_._,___

Macroperu Inversiones de Chile en el Peru y el mundo 1990 - 2010


Inversiones de Chile en el Peru y el mundo 1990 - 2010

El Ministerio de Relaciones Exteriores de Chile ha realizado un estudio denominado La Inversion Directa de Capitales Chilenos en el Mundo 1990 - 2010

En el  periodo 1990 - 2010 las inversiones realizadas fuera de Chile es de US$ 56,789 Millones de Dolares de los cuales US$ 9,999 Millones de dolares han sido invertidos en el Peru.


El estudio indica que el Perú es la tercer receptor de inversiones en el periodo 1990 - 2010 , en el 2010 las Inversiones de Chile en el Perú han sido de US$ 1,829 Millones de dólares convirtiéndonos en el principal receptor de las inversiones de Chile que representa el 42% de las inversiones realizadas por Chile en ese año, el estudio también indica que el empleo directo generado en ese periodo es de 56,306 persona y el empleo indirecto es de 19,375 haciendo un total de 75,681 persona empleadas.


Pueden ver el articulo completo y el estudio en:
 
Saludos,
 
Econ. Walter Espinoza V.


__._,_.___
Recent Activity:
    .

    __,_._,___

    Economy, Money in Politics It's the Inequality, Stupid Illustrations by Jason


    Plutocracy Now

    EEUU: Treinta años después del Neo-liberalismo. 

    It's the Inequality, Stupid

    imagecache imagecache-master-image imagecache-default imagecache-master-image_defaultIllustrations by Jason Schneider

    Eleven charts that explain everything that's wrong with America.

    — By Dave Gilson and Carolyn Perot

    A huge share of the nation's economic growth over the past 30 years has gone to the top one-hundredth of one percent, who now make an average of $27 million per household. The average income for the bottom 90 percent of us? $31,244.

    Average Income by Family, distributed by income group.

    The richest controls 2/3 of America's net worth

    Note: The 2007 data (the most current) doesn't reflect the impact of the housing market crash. In 2007, the bottom 60% of Americans had 65% of their net worth tied up in their homes. The top 1%, in contrast, had just 10%. The housing crisis has no doubt further swelled the share of total net worth held by the superrich.

    The superrich have grabbed the bulk of the past three decades' gains.

    Aevrage Household income before taxes.

    A Harvard business prof and a behavioral economist recently asked more than 5,000 Americans how they thought wealth is distributed in the United States. Most thought that it's more balanced than it actually is. Asked to choose their ideal distribution of wealth, 92% picked one that was even more equitable.

    Average Income by Family, distributed by income group.

    Why Washington is closer to Wall Street than Main Street.

    median net worth of american families, median net worth for mebers of congress, your odds of being a millionaire, member of congress's odds of being a millionaire
    Rep. Darrell Issa (R-Calif.) $451.1 million
    Rep. Jane Harman (D-Calif.) $435.4 million
    Rep. Vern Buchanan (R-Fla.) $366.2 million
    Sen. John Kerry (D-Mass.) $294.9 million
    Rep. Jared Polis (D-Colo.) $285.1 million
    Sen. Mark Warner (D-Va.) $283.1 million
    Sen. Herb Kohl (D-Wisc.) $231.2 million
    Rep. Michael McCaul (R-Texas) $201.5 million
    Sen. Jay Rockefeller (D-W.Va.) $136.2 million
    Sen. Dianne Feinstein (D-Calif.) $108.1 million
    10 Richest Members of Congress 100% Voted to extend the cuts

    Congressional data from 2009. Family net worth data from 2007. Sources: Center for Responsive Politics; US Census; Edward Wolff, Bard College.

    For a healthy few, it's getting better all the time.

    Gains and Losses in 2007-2009, Average CEO Pay vs. Average Worker Pay


    A millionaire's atx rate, now and then. Share of Federal Tax revenue

    How much income have you given up for the top 1 percent?


    Sources

    Income distributionEmmanuel Saez (PDF)

    Net worth: Edward Wolff (PDF)

    Household income/income share: Congressional Budget Office

    Real vs. desired distribution of wealth: Michael I. Norton and Dan Ariely (PDF)

    Net worth of Americans vs. Congress: Federal Reserve (average); Center for Responsive Politics(Congress)

    Your chances of being a millionaire: Calculation based on data from Wolff (PDF); US Census (household and population data)  

    Member of Congress' chances: Center for Responsive Politics

    Wealthiest members of Congress: Center for Responsive Politics

    Tax cut votes: New York Times (SenateHouse)

    Wall street profits, 2007-2009: New York State Comptroller (PDF)

    Unemployment rate, 2007-2009: Bureau of Labor Statistics

    Home equity, 2007-2009: Federal Reserve, Flow of Funds data, 1995-2004 and 2005-2009 (PDFs)

    CEO vs. worker pay: Economic Policy Institute

    Historic tax rates: Calculations based on data from The Tax Foundation

    Federal tax revenue: Joint Committee on Taxation (PDF)

    Read also: Kevin Drum on the decline of Big Labor, the rise of Big Business, and why the Obama era fizzled so soon.

    More Mother Jones charty goodness: How the rich get richerhow the poor get poorer;who owns Congress?

    Dave Gilson is a senior editor at Mother Jones. For more of his stories, click here. Get Dave Gilson's RSS feed.

    • Digg
    •  
    • Facebook
    •  
    • Reddit
    •  
    • StumbleUpon

    Get Mother Jones by Email - Free. Like what you're reading? Get the best of MoJo three times a week.

    __._,_.___
    Recent Activity:
      .

      __,_._,___

      1 feb 2011

      Macroperu Global food prices and inflation targeting

      Global food prices and inflation targeting

      Luis AV Catão   Roberto Chang
      27 January 2011


      Rising food prices once again pose central banks a tricky question. How far should they ignore food price inflation? This column suggests that food tends to have stronger predictive power on global inflation cycles than oil. The problem is more severe in emerging markets where consumption basket weights for food are two or three times larger than in rich nations. Central banks should pay close attention.


      The uneven recovery in advanced countries is hiding an issue that, while off the agenda in the last G20 meeting back in November, is arguably no less urgent for the global economy – namely, the rise in food prices.

      • Following a steep acceleration initiated last summer, global food prices (as measured by the IMF global food price index) rose by 21% in the year leading up to November 2010 (latest available figure).
      • Global average food prices are now back to their pre-crisis peak, despite a collapse in the wake of the 2008/09 financial crisis,

      Coupled with the most recent round of weather setbacks and slashes in key crop forecasts worldwide, there is little hope that such inflationary pressures will abate. If anything, the US and EU economic recovery will exacerbate them.

      In advanced countries, these developments have not yet percolated through the inflation outlook, which remains broadly dormant due to offsetting effects of falling manufacturing prices and continuing slack in labour markets. But this isn't so elsewhere.

      • In emerging markets, non-trivial deviations from targeted inflation have begun to emerge.
      • Food price sub-indices are well ahead of headline inflation, often two to three times as fast.

      This is particularly alarming insofar as much of the acceleration in food inflation in emerging markets comes from basic staples such rice and corn, with seemingly limited scope for substitutability in consumption baskets.

      In Indonesia, for instance – where per capita rice consumption is higher than the Asian average – rice prices were up by as much as 30% in the year to December. Subsidies and tariffs, meanwhile, have mitigated the external price pass-through only to a limited extent elsewhere in the continent. From Jakarta to Mexico City, stories of rising imports making up for significant shortfalls in the domestic supply of such staples continue to abound.

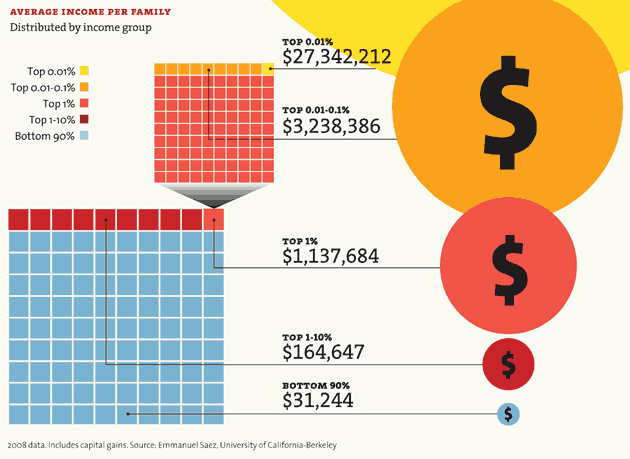
      With food typically weighing 20% to 50% in national consumption baskets in developing countries, as opposed to 12% to 15% in core advanced countries (see Table 1), this "decoupling" in the inflation outlook is hardly surprising. But it does not make the issue of global food inflation any less critical looking forward.

      While longer-term price projections for some these staples portray a bright picture for many emerging markets in terms sustainable terms-of-trade gains over the current decade (OECD-FAO 2010), the ongoing acceleration in food prices creates important dilemmas for monetary policy in net food exporters and importers alike over the near term.


      http://www.voxeu.org/sites/default/files/image/FromAug2010/CataoTbl1.gif

      Food inflation more important than oil price rises

      History is adamant on the risks. While much has been made of oil prices as drivers of global inflationary spurts since the 1970s, recent work of ours (Catão and Chang 2010) provides evidence that food price pressures have been no less important. The data in fact suggests that food tends to have stronger predictive power on global inflation cycles than oil.

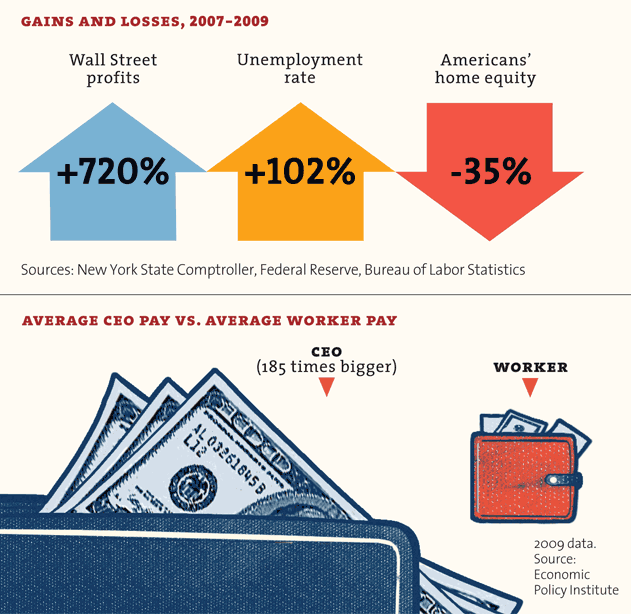
      As Figure 1 illustrates, every single inflation upturn over the past four decades has been preceded (with a one to two-year lag) by an uptick in world food prices; this causality relation is confirmed by formal econometric tests. To be sure, one could arguably blame such past slippages on the looser monetary regimes of the 1970s and 1980s. Yet, later experience indicates that this transmission mechanism remains quite alive in the more recent era of inflation targeting too.

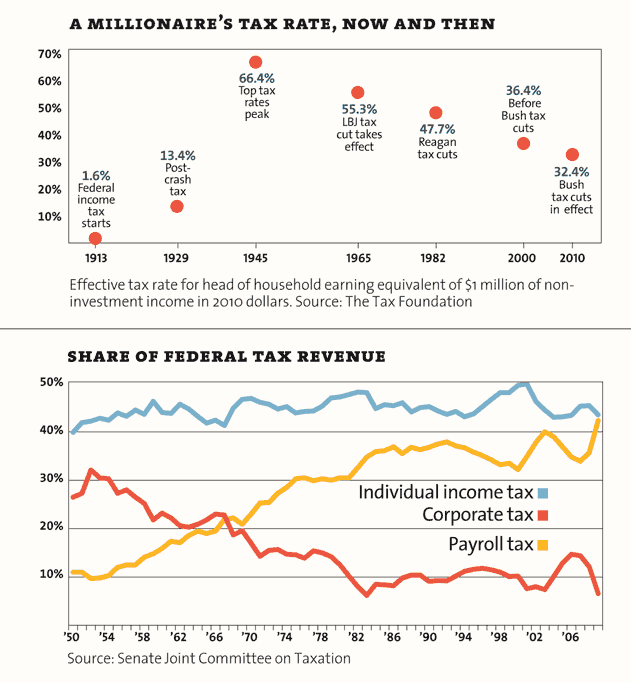
      This is portrayed in Figure 2, which plots the IMF global indices of food and oil prices (measured along the left vertical axis) against the cross-country median of percentage deviations from the central inflation targets (measured along the right vertical axis) for all countries that have formally adopted inflation targeting. Clearly, the large swings since 2006 in deviations of actual from targeted inflation have coincided with attendant swings in world food prices. Further, Figure 2 also confirms that food prices are better predictors of global inflation than oil prices. While oil prices began to climb up in earnest from 2003, significant deviations from targeted inflation only materialised after food prices took off from late 2006. In short, there is substantial evidence – both recent and well-past – that food prices lurk behind large international swings in inflation rates.

      Figure 1. 

      http://www.voxeu.org/sites/default/files/image/FromAug2010/CataoFig1.gif

      Figure 2. 

      http://www.voxeu.org/sites/default/files/image/FromAug2010/CataoFig2.gif

      Against this background, a key question to national central banks is the extent to which such imported inflation should be accommodated. In the case of large central banks like the ECB and the US Federal Reserve, two considerations stand out.

      • The first is that their actions have a direct bearing on global food price given their weight in world income and capacity to set world interest rates, influencing food prices via both demand and supply channels.
      • The second is that their actions have strong externalities elsewhere. In the emerging/developing world, this can be far-reaching because food accounts for a very high share in consumer spending and, since much of it consists of non high-end items, it cannot be substituted away.

      Well-known structural weaknesses of developing countries add to the problem. Soaring food inflation can trigger far-reaching unrest wherever political institutions are fragile, financial systems are less mature to smooth out shocks, and social safety nets inadequate, as witnessed by the many food-related riots during 2007-08.

      What should monetary policy do?

      A situation that deserves special consideration is that of the worst sufferer – the price-taking small-open economy that is a net food importer with a share of food in the national consumption basket far larger than that of the advanced world. In that case, our work (Catão and Chang 2010) indicates that monetary authorities should not accommodate the attendant rise in CPI inflation even if they do not practice price level targeting. In fact, among the policy rules usually adopted by central banks, the strict targeting of broad CPI inflation is often the best for domestic welfare.

      In other words, setting monetary policy on the basis of CPI inflation stripped from its commodity price sub-indices, or targeting domestic producer inflation, is less advisable. This is so because CPI targeting strikes a better balance between stabilising the real exchange rate, which in turn helps stabilise domestic consumption, and keeping domestic producer inflation under control without over compressing it.

      The reason it is desirable to stabilise domestic producer costs (and hence prices) is that not all producers in this small open economy are free to set prices at any moment, which distorts relative prices across producers, which is sub-optimal. This is more critical the more persistent the food price shocks; and the empirical evidence suggests that such shocks are typically very persistent.

      Completely stabilising domestic prices, however, is not desirable because it robs some latitude from domestic producers, given imperfect international arbitrage in goods markets, to raise prices, which will be partly paid for by the foreign consumer. Allowing domestic prices to be set a bit higher on average as a reaction to volatile food prices (and hence to volatile wages and costs), the small-economy policymaker makes more effective use of the so-called "terms of trade externality".

      Finally, as greater real-exchange-rate stabilisation also helps stabilise the purchasing power of food-intensive consumption baskets, the distributive consequences of CPI inflation targeting are less dire than those of producer price inflation targeting. This is particularly relevant for countries with highly skewed income distribution and inadequate social safety nets. So, as with some of the literature on oil price shocks (see e.g. Batini and Terenu 2010; Blanchard and Gali 2007 and references therein), the above considerations make a case for a non-accommodating policy stance toward imported food inflation.

      Yet, judged by standard estimates of the Taylor rule, strict adherence to broad CPI targeting appears to have been the exception and not the rule during rampant food inflation in 2007-08. To the best of our knowledge, this observation has not gained due currency in policy circles and/or among market observers and, yet, is readily apparent.

      Table 2 reports regressions of the policy interest rate on its first-order lag, the HP-filtered output ("ygap"), and on current CPI inflation ("CPI inf"). Because central inflation targets move over time in some countries, both the interest rate and the inflation rate are measured as deviations from the central inflation target. Finally, the set of explanatory variables includes the interaction of inflation with a dummy which equals 1 during the food price hike of 2007Q1-2008Q3 and zero otherwise. A negative coefficient on this interaction term indicates that policy rates were set lower in 2007Q1-2008Q3 than they should have been, relative to the average reaction. That coefficient is negative in all Table 2 countries except New Zealand; it is also statistically significant at 10% or less in half of them. This is all the more surprising in light of evidence that food price shocks tend to be highly persistent and that monetary policy operates with long lags, particularly in advanced countries. One might expect these two considerations to trigger a more prompt and aggressive response to the 2007-08 hike.

      Table 2. Descriptive Taylor rule estimates

      http://www.voxeu.org/sites/default/files/image/FromAug2010/CataoTbl2%282%29.gif

      This apparent leniency in individual policy responses – at least when measured relative to standard Taylor rule baselines – had global implications. World real interest rates would otherwise have been higher, which in turn would have helped dampen commodity prices and possibly contain the widening in global imbalances. Higher world interest rates at the onset of the crisis would also have given central banks more latitude for subsequent easing, possibly obviating widespread resort to heterodox measures like quantitative easing.

      Policy lessons

      Going forward, what lessons can we take from this evidence?

      • First and foremost, global food price pressures pose a sizeable threat to global monetary stability.
      • Second, they pose an externality problem that demands non-trivial coordinated action by key central banks.

      Left alone, we should fear that coordinated action may come in too little and too late because the inflation spillovers are largely felt first in emerging markets (again, much due to higher food shares in consumption baskets) and because individual advanced societies are better equipped to withstand such a price shock at least for a while. So, the associated policy prescription is hardly "one-size-fits all". These various considerations suggest that strict and widespread targeting of broad CPI inflation, while not a silver bullet, does help.

      To be sure, the more aggressive interest rate reaction to imported food inflation demanded by broad CPI inflation targeting raises well-known problems of its own for the small open economy, particularly regarding capital inflows. Standard macro models featuring complete international capital markets and frictionless domestic financial intermediation are ill-suited to address these problems. While developments in this area of research are promising, they still fall short of offering clear-cut prescriptions to policy makers. Absent that, the targeting of broad CPI inflation, when consistently implemented, appears to be a stronger contender than other rules in terms of mitigating monetary policy externalities on a global basis and helping keep global inflationary pressures at bay.

      The views expressed in this article are the sole responsibility of the authors and should not be attributed to the International Monetary Fund, its Executive Board, or its management.

      References

      Batini, Nicoletta and Eugene Tereanu (2010), "Inflation targeting during asset and commodity price booms", Oxford Review of Economic Policy, 25:15-35.

      Blanchard, Olivier and Jordi Gali (2007), "The macroeconomic effects of oil shocks: why are the 2000s so different from the 1970s", NBER Working Paper13368.

      Catão, Luis AV and Roberto Chang (2010), "World food prices and monetary policy", NBER Working Paper 16563.

      OECD-FAO (2010), Agricultural Outlook 2010-2019, Paris.


      This article may be reproduced with appropriate attribution. See Copyright (below).

      __._,_.___

      __,_._,___

      Fwd: Macroperu GDP falls for first time since recession The UK economy contracted in the final


      GDP falls for first time since recession

      The UK economy contracted in the final three months of 2010, official figures revealed, stunning markets and reigniting fears that the recovery may yet degenerate into a double-dip recession.

      An official replaces a British flag while EU heads of state arrive at an informal summit in Brussels
      Short sterling futures - trades which indicate when markets think interest rates will rise - showed investors are no longer betting on a hike before June Photo: Reuters
      By Emma Rowley 8:44PM GMT 25 Jan 2011

      Comment

      Gross domestic product (GDP) fell 0.5pc on the previous quarter, according to the Office for National Statistics (ONS), as December's severe weather helped push growth into negative territory.

      However, the ONS said that even without the snow disruption, there would have been zero growth.

      The data fell short of the most cautious predictions, let alone the consensus forecast for 0.5pc growth.

      "This is a horrendous figure. An absolute disaster," said Hetal Mehta, an economist at Daiwa. "It seems that the economy is incredibly vulnerable. And with the fiscal tightening yet to fully bite, we have to brace ourselves for a bumpy ride."

      Mervyn King, Governor of the Bank of England, said the GDP figures were evidence of the "choppy" recovery he had predicted but voiced his greater focus on inflation.

      The pound hit its lowest level in a month against the dollar, trading 1.5pc down at one point, as markets judged the chances of the Bank raising rates soon were receding, despite it facing criticism about over-target inflation.

      Short sterling futures - trades which indicate when markets think rates will rise - showed investors are no longer betting on a hike before June, given the threat that making borrowing more costly might pose to growth.

      Brent oil also tumbled almost $2 to $94.75 on the news, although it had recovered 75 cents as the UK markets closed.

      Analysts were divided as to what the data signalled for the UK in coming months, as the ONS noted the snow's impact was "inevitably uncertain" at this stage.

      Enam Ahmed, an economist at Moody's Analytics, said the chances of a double-dip were now "very high". However, others were less negative, questioning whether underlying growth was really "flattish" as the ONS judged.

      George Buckley, an economist at Deutsche Bank, said there might even be a sizeable rebound in the current quarter as the economy sees some catch-up of lost business.

      Chancellor George Osborne said the contraction would not derail his austerity plans, despite expectations that public spending cuts will slow growth further.

      Overall the economy grew just 1.4pc in 2010 on the previous year, far short of the 1.8pc predicted by the Office for Budget Responsibility, the independent fiscal watchdog.

      Construction was the worst performer, with output shrinking 3.3pc on the previous quarter. The slide was not a huge shock, given the sector's vulnerability to bad weather.

      Perhaps more worryingly, the mammoth services sector, which accounts for three quarters of national output, also slid into negative territory, shrinking 0.5pc. The contraction accounted for most of the overall fall in the headline GDP figure.

      The sector's weather-sensitive areas such as restaurants and transport took a hit, as expected, but areas such as computer services also suffered, suggesting weakening demand caused problems, as well as the weather.

      Manufacturing remained the recovery's success story, expanding 1.4pc. However, the sector accounts for less than 13pc of output.

      Separately, figures for December showed the public sector borrowed £16.8bn last month, a drop on the £21bn figure of 12 months earlier and less than expected after November's record £21.1bn. However, the ONS noted that borrowing in December 2009 saw the UK inject capital into the banks, distorting the comparison.

      Total receipts from taxes and income were up 3.9pc, but the improvement was outpaced by total expenditure rising 5.2pc – a slowdown from November, but still indicating that spending kept growing, despite Government efforts.

      The figures also took state-backed banks RBS and Lloyds on to the nation's balance sheet for the first time, which added £1.3 trillion to the UK's net debt, taking it to £2.3 trillion or 155pc of GDP.

      .

      __,_._,___

      ENTREVISTAS TV CRISIS GLOBAL

      NR.: Director, no presidente ---------------------------------------------- Bruno Seminario 1 ------------------------- Bruno Seminario 2 -------------------- FELIX JIMENEZ 1 FELIZ JIMENEZ 2 FELIX JIMENEZ 3, 28 MAYO OSCAR DANCOURT,ex presidente BCR ------------------- Waldo Mendoza, Decano PUCP economia ---------------------- Ingeniero Rafael Vasquez, parlamentario 24 set recordando la crisis, ver entrevista en diario

      Etiquetas

      Peru:crisis impacto regional arequipa,raul mauro

      Temas CRISIS FINANCIERA GLOBAL

      QUIEN SOY?
      claves para pensar la crisis

      MATERIAS PRIMAS
      -Metales
      -Cobre
      - plata
      - oro
      - zinc
      - plomo
      - niquel
      - petroleo

      -Tipo de cambio

      - LA CRISIS

      - BOLSA VALORES
      - BANCOS
      - PBI PAISES
      - USA: DEFICIT GEMELOS
      - UE: RIEN NE VA PLUS

      CONTAGIO: CANALES

      - PERU: DIAGRAMA DE CONTAGIO
      - PERU: IMPACTO EN BOLSA
      - MEXICO: HAY CRISIS?

      LA PRENSA
      COMENTARIO DE HOY

      - DIARIOS DE HOY
      NLACES

      Coyuntura
      Bancos centrales
      Paginas Recomendadas

      BLOGS

      economiques
      Interes

      VIDEO

      - Economia videos
      - Crisis financiera global

      TRICONTINENTAL

      - AFRICA: daniel
      - EUROPA: helene
      - ASIA:
      - AMERICA

      COLUMNAS AMIGAS

      Chachi Sanseviero

      ETIQUETAS
      por frecuencia de temas
      por alfabetico

      EVENTOS

      FOTOS DEL PERU

      GONZALO EN LA RED

      JOBS
      VOZ ME CONVERTIDOR
      CLIMA
      SUDOKU
      PICADURAS

      LOGO

      LIBRO de GONZALO

      La exclusion en el Peru

      -Presentacion

      - introduccion

      - contexo economico

      - crisis de la politica

      - excluidos de las urbes

      - excluidos andinos

      - contratapa

      VIDEOS ECONOMICOS
      Crisis Enero 2009
      Krugman
      Globalizacion 1
      Globalizacion 2
      Crisis Brasil
      Crisis bancaire
      Karl marx revient

      TODOS LOS DERECHOS RESERVADOS

      GOOGLE INFORMA


      PRESS CLIPPINGS-RECORTES PRENSA-PRESSE..

      ETIQUETAS alfabetico